
Although React Native has existed for a few years, it is still a young technology—for example, it has not had a major version released yet. So when developing mobile apps with React Native, you won’t have as many developer tools to choose from as you would when developing an app for more established platforms like a browser. As a result, debugging React Native apps can be challenging. But you can make debugging React Native apps a smoother experience if you use the right tools.
There is no one size fits all solution to debugging. For this article, the examples will assume a development setup of Mac, iOS, and Expo. Depending on the setup you’re working with, the specific steps to open the tools will be slightly different. The tools covered are not meant to fill an entire toolbox for fixing every bug but can be used as a great starter for debugging React Native apps.
Investigate UI Bugs with Element Inspector
Regardless of the technology you’re working with, the first step for fixing any bug is to get a better idea of what is happening. The browser’s developer tools are an excellent place to start when working on the web. But when using React Native to build mobile apps, we are no longer using React to build apps that run in a browser. Because of this, we don’t have the luxury of being able to use the browser’s developer tools. Instead, we need to use a different set of tools to start investigating bugs.
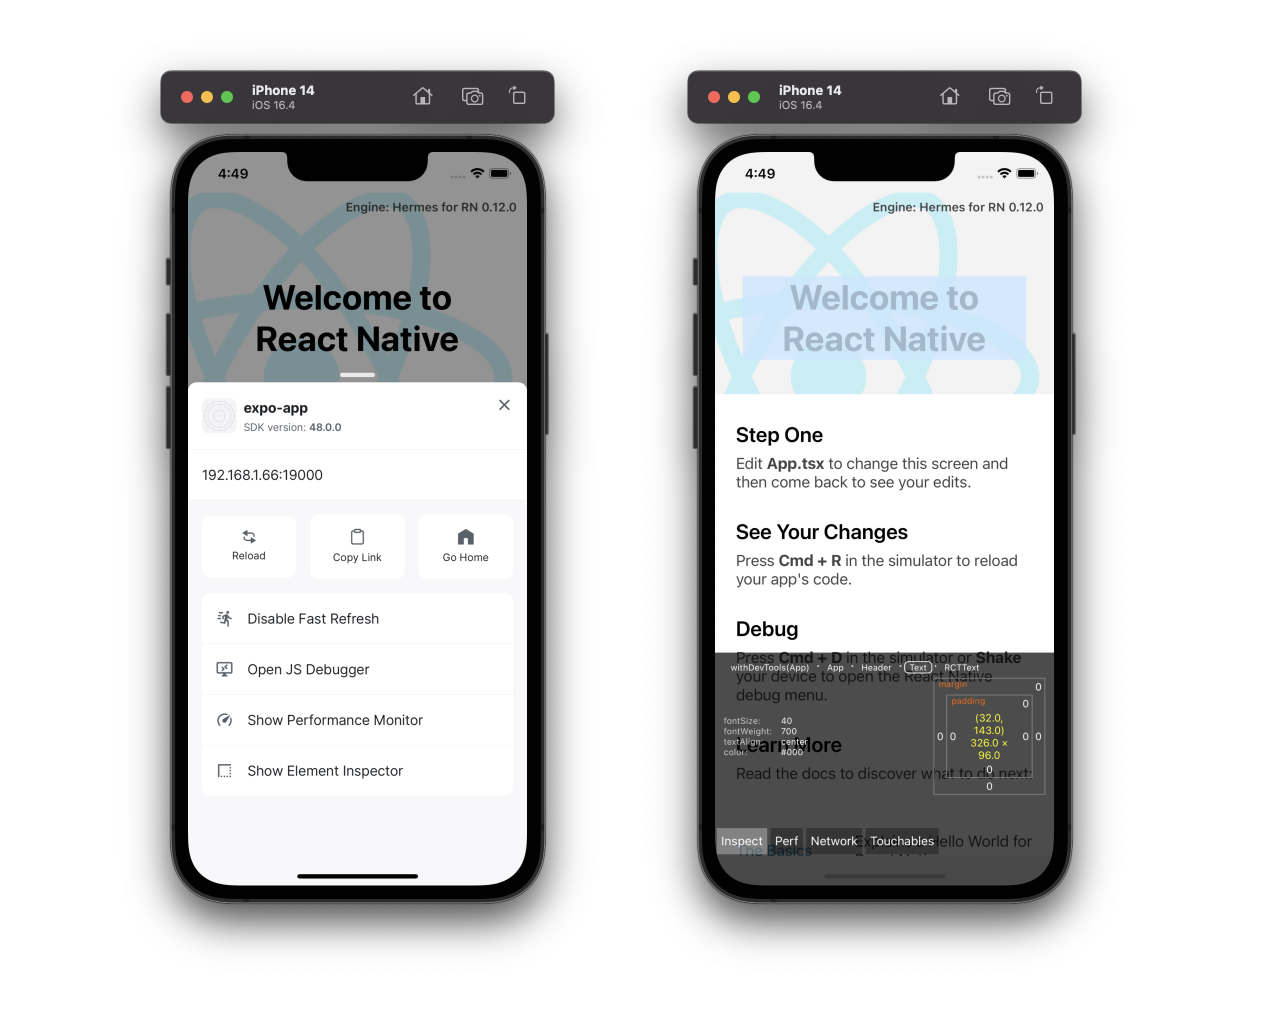
When a bug is causing visual elements to display in unexpected ways, such as an element being incorrectly sized, the “Element Inspector” is a great place to start. For React Native apps, the Element Inspector functions similarly to the Element Inspector in a browser which makes it the perfect tool for double-checking that your app is correctly applying styles to visual elements.
To open the Element Inspector you must first open the developer menu. When developing with an iOS simulator, you can open the developer menu by pressing the keys Ctrl + Cmd ⌘ + z. Once the menu is open, select “Show Element Inspector” and then select any element to inspect it.
Dig Deeper with React Developer Tools
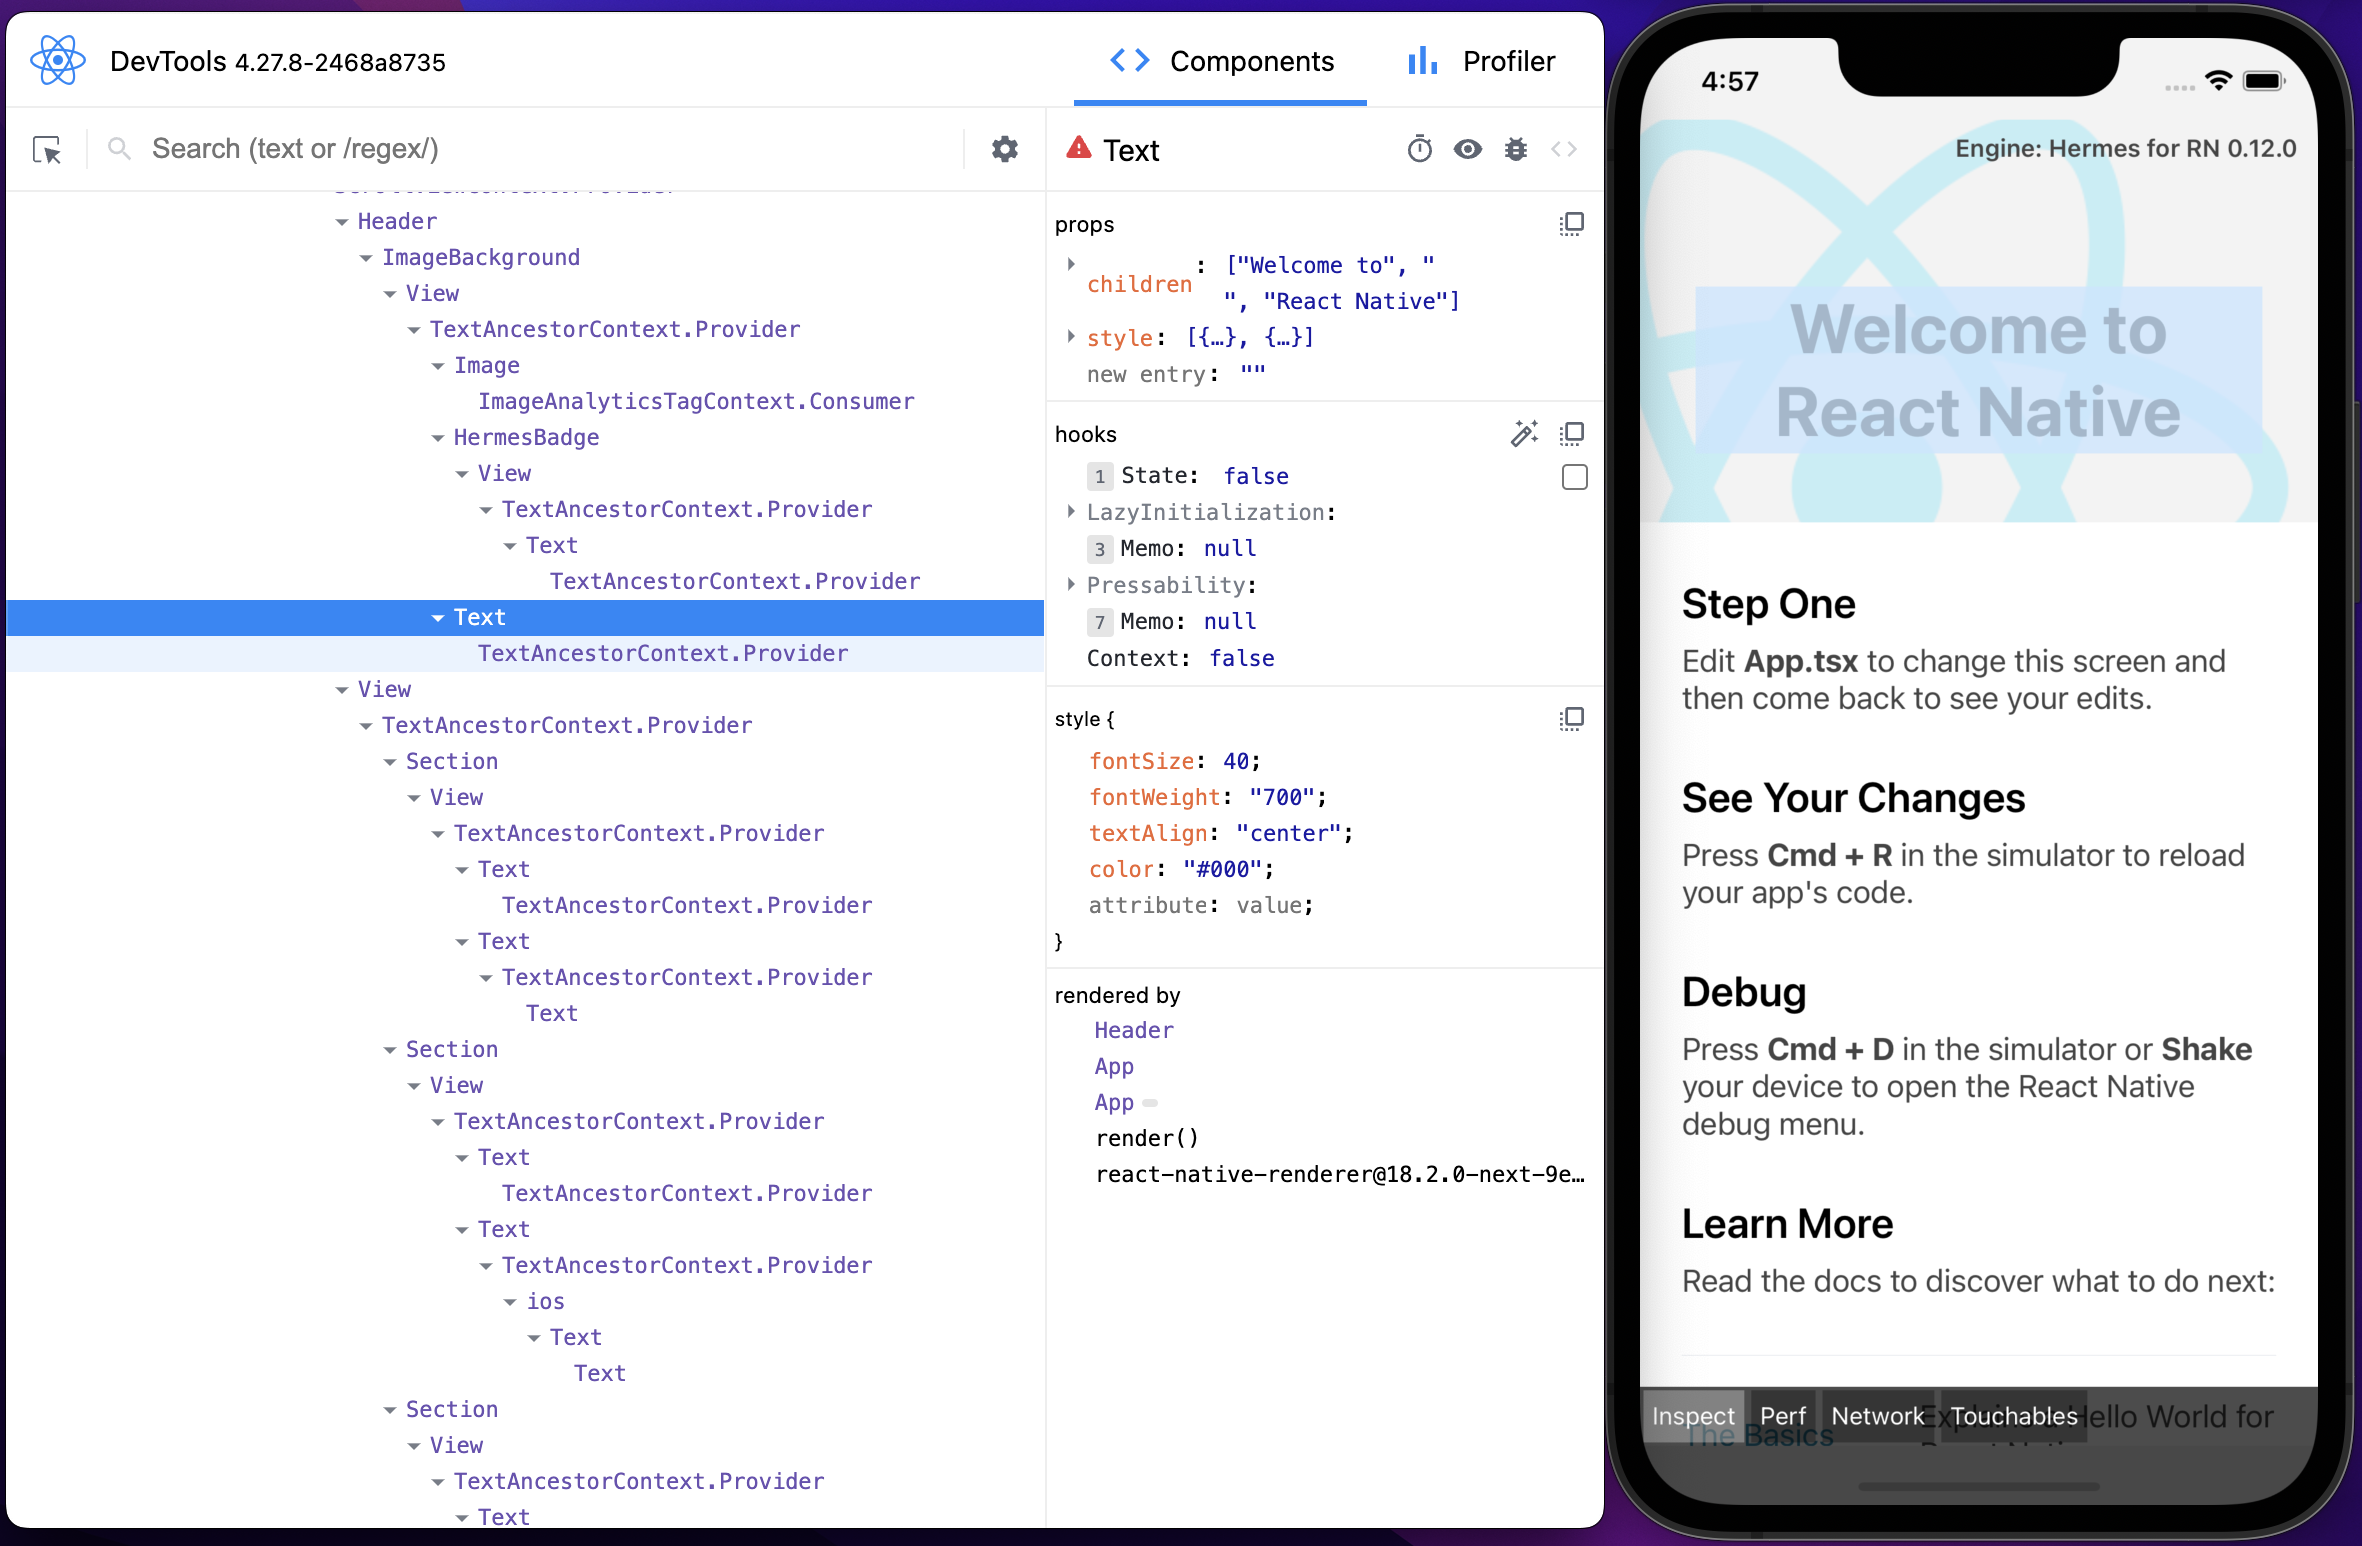
While the Element Inspector is an excellent tool to start debugging, many bugs cannot be solved by using just the Element Inspector. To solve these bugs, you’ll need additional tools that can help you investigate the problem in ways the Element Inspector can’t. One great tool for this is the React developer tools.
You may already be familiar with the React developer tools if you have used React to develop web apps. In addition to being able to use the React developer tools in the browser, it’s possible to use them with non-browser-based React applications. To use the React developer tools with a React Native app, open a terminal and then run the command npx react-devtools to open the developer tools. Next, connect your app to the developer tools by opening your app in a simulator. If your app is already running in a simulator, you may need to refresh it for it to connect. (Extra steps may be required if you are not developing your app with Expo.)
Step Through Code With Chrome Developer Tools Debugger
For difficult bugs, using a debugger to run through the problematic parts of your code step by step is often helpful. Until recently, if you wanted to use a debugger with a React Native app, the debugger would not run your app’s JavaScript on your phone or simulator. Instead, the debugger would have to run your app’s JavaScript in a different environment, such as a web worker thread in Chrome.
This process, known as “remote debugging,” was difficult to use and did not give users a fully accurate picture of how an app ran code. Now with some React Native apps, you are no longer limited to remote debugging, and it is possible to use the Chrome Developer Tools debugger just like you would with a web app.
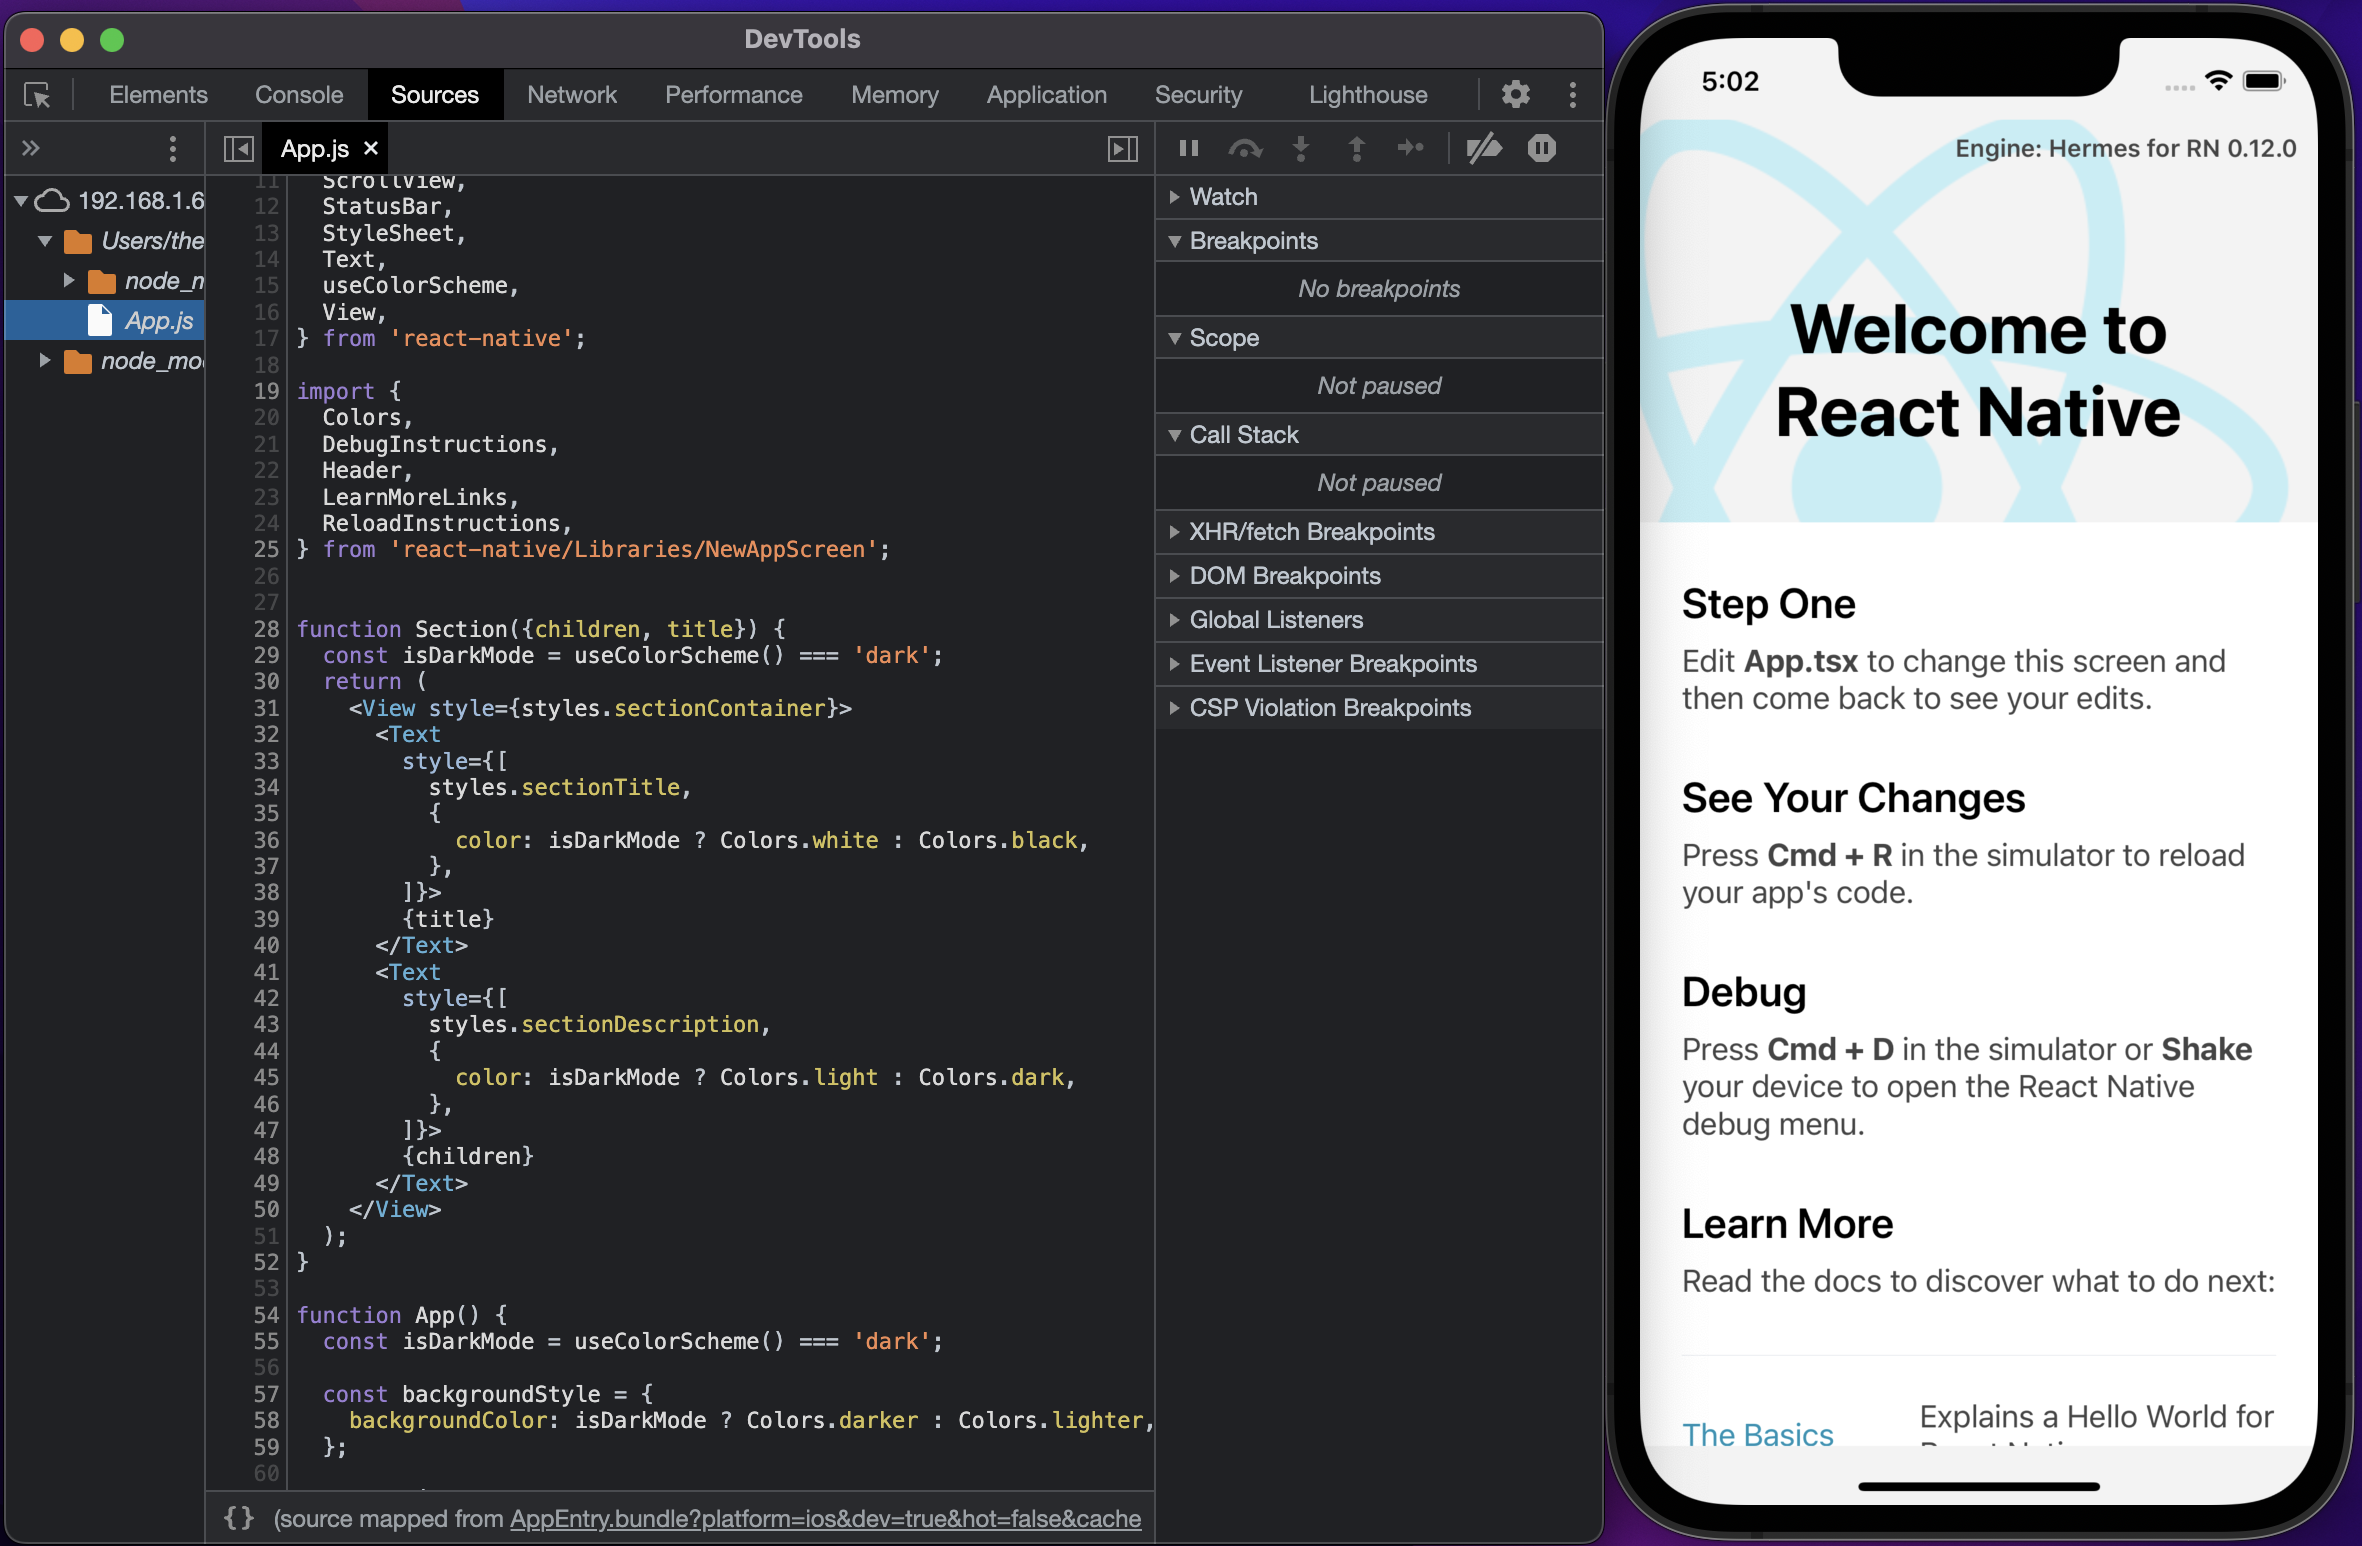
For apps that use Expo, you can open the Chrome Developer Tools by opening the developer menu and clicking “Open JS Debugger.” If instead of seeing “Open JS Debugger,” you see “Debug Remote JS,” your app is currently limited to only being able to use remote debugging. For more on how to set up your Expo and React Native app so that you can use the debugger, see the official Expo Documentation.
The debugger in Chrome Developer Tools is a very powerful tool, but it can take some getting used to. If you haven’t used it before, it would be a great idea to visit the Chrome Developer documentation. In there, you can find a tutorial that teaches you the basic workflow for debugging JavaScript issues with the Chrome Developer Tools as well as additional resources.
When In Doubt, Research
Sometimes when working in React Native, you will encounter a bug that is present on iOS or Android, but not both. Although React Native lets you build apps for Android and iOS using the same code, sometimes the code you write will work differently on different platforms. Additionally, any third-party libraries you are using also have the potential to work differently on different platforms.
In these situations, the best way to tackle these bugs is often to do research. Often the best place to start researching is the official React Native documentation or the documentation for any library you think might be causing your bug.
In addition to reading documentation, checking to see if others have run into the same problem can be a great way to solve bugs. For example, if you are running into an issue using a particular library in your app and the library is hosted on GitHub, searching the issue list in the library’s repository is an excellent way to see if others have had the same problem.
Conclusion
Even though debugging in React Native often feels like a challenge, using the right tools can make a difference. While the above-mentioned tools won’t solve every problem, they are great tools to add to your React Native debugging toolbox. Debugging can often be more art than science, so be flexible and exercise your creativity when facing difficult bugs. One of the best things you can do to make debugging easier is to continue learning and adding new tools to your debugging toolbox.